이 글은 단계별로 쓰여진 글이며 첫번째 단계를 보기 위해서는 아래 게시글을 참고 바람!
[AI OpenCV-Python] SIFT를 통한 이미지 특징 추출 (1) (Image Feature Extraction/Matching Using SIFT)
이 글은 Google Colab 환경에서 실행 되었습니다. !cat /etc/*release 출력: DISTRIB_ID=Ubuntu DISTRIB_RELEASE=20.04 DISTRIB_CODENAME=focal DISTRIB_DESCRIPTION="Ubuntu 20.04.5 LTS" NAME="Ubuntu" Google Colab의 환경은 Linux Ubuntu이니 참
greedy-engineer.tistory.com
SIFT 이미지 매칭
SIFT를 이용하여 이미지의 keypoint와 keypoint가 갖고 있는 descriptor를 통해 두 이미지의 유사도를 비교하는 방법이다. 주로 어떤 이미지에 다른 이미지가 포함되어 있거나 닮은 점을 분석할 때 쓰인다. 서론은 그렇고, 이제 본격적으로 실습해보자!
이미지 설정
항상 가장 먼저 해야 할 일은 환경 설정이다. 이번에는 미리 다운로드 받은 항공샷 이미지를 사용한다.
참고로 코딩 환경은 Google Colab이다.
!pip install opencv-python==3.3.0.10
!pip install opencv-contrib-python==3.3.0.10

!wget https://raw.githubusercontent.com/opencv/opencv/master/samples/data/building.jpg
!wget https://raw.githubusercontent.com/opencv/opencv/master/samples/data/aero1.jpg
!wget https://raw.githubusercontent.com/opencv/opencv/master/samples/data/aero3.jpg
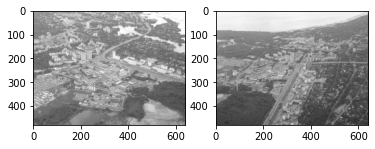
이미지가 어떻게 생겼는지 알고가자! 전 게시글에 똑같은 내용이 있으니 빠르게 넘어가도록 하겠다. 이미지 매칭(비교)를 위해서 일부러 비슷해 보이는 이미지 두 개를 가지고 왔다.
# SIFT 특징 매칭을 위한 이미지 설정
aero1 = cv2.imread('./aero1.jpg')
aero2 = cv2.imread('./aero3.jpg')
gray1 = cv2.cvtColor(aero1, cv2.COLOR_BGR2GRAY)
gray2 = cv2.cvtColor(aero2, cv2.COLOR_BGR2GRAY)

plt.subplot(1,2,1)
plt.imshow(cv2.cvtColor(gray1, cv2.COLOR_BGR2RGB))
plt.subplot(1,2,2)
plt.imshow(cv2.cvtColor(gray2, cv2.COLOR_BGR2RGB))
plt.show()
SIFT 특징 추출
먼저 sift 객체를 만들고, keypoint와 descriptor를 동시에 추출하는 sift.detectAndCompute를 사용하였다. kepoint와 descriptor가 너무 많아서 둘다 절반으로 줄인 상태이다! 궁금하면 그냥 진행해도 된다. 단지 복잡할 뿐...
# SIFT 특징 추출
sift = cv2.xfeatures2d.SIFT_create()

kp1, des1 = sift.detectAndCompute(gray1, None)
kp2, des2 = sift.detectAndCompute(gray2, None)


kp1 = kp1[0:len(kp1):2]
kp2 = kp2[0:len(kp2):2]

des1 = des1[0:len(des1):2]
des2 = des2[0:len(des2):2]

print("첫번째 이미지의 keypoint: ", len(kp1), " 첫번째 이미지의 descriptor: ", des1.shape)
print("두번째 이미지의 keypoint: ", len(kp2), " 두번째 이미지의 descriptor: ", des2.shape)output:
첫번째 이미지의 keypoint: 2126 첫번째 이미지의 descriptor: (2126, 128)
두번째 이미지의 keypoint: 1517 두번째 이미지의 descriptor: (1517, 128)
역시 전 게시글에서 다룬 내용이므로 생략한다!
MATCHER를 이용한 특징들 간의 거리 비교
특징들이 얼마나 비슷하고 다른 지를 보기 위해서 특징들 간의 거리를 측정하는 Brute Force Matcher를 사용한다. opencv에서 기본으로 제공되며, 인공지능에서 가장 많이 쓰이는 L2 distnace를 사용한다.
# Brute Force Matcher를 이용한 특징 비교
bf_match = cv2.BFMatcher(cv2.NORM_L2) # L2 distance를 이용한다
bf_matches = bf_match.knnMatch(des1, des2, k=2)
print(len(bf_matches))output: 2126
bf_match.knnMatch는 des1, des2, k=2 를 인수로 받고, des1에 모든 descriptor를 des2에 모든 descriptor와 비교하여 후보 2개 (k = 2)를 뽑는다. bf_matches 의 길이는 첫번째 이미지의 keypoint의 개수와 같으며, 총 2126개의 원소 안에 2개의 후보가 들어있다. 실제로 개별 원소는 2126 x 2 개가 있다.
bf_matches와 친해지기
bf_matches안에 각 원소들에는 후보 2개가 들어 있다. 각 후보의 distance는 keypoint에 descriptor가 얼마나 유사한지, 다른 지를 나타낸다.
print(bf_matches[0][0].distance)
print(bf_matches[0][0].queryIdx == bf_matches[0][1].queryIdx)
print(bf_matches[0][1].distance)
print(bf_matches[0][0].trainIdx, "<- DIFFERENT ->", bf_matches[0][1].trainIdx)output:
318.089599609375 첫번째 후보의 distance (당연히 작을수록 좋다)
True queryIdx는 des1의 원소 중 하나이므로 같다
355.7948913574219 두번째 후보의 distance
1372 <- DIFFERENT -> 1295 trainIdx는 des2의 원소들 중 distance가 작은 후보 2 개이므로 값이 다르다
좋은 matches 가려내기
과연 추출한 matches들이 전부 다 의미가 있을까? 아니다. 여기서 우리가 후보를 2개 뽑은 이유가 나온다. 후보 2명이 있을 때, 1등과 2등의 격차가 클수록 확실한 1등이라고 생각할 수 있다. 그 논리를 생각하며 아래 코드를 보자!
# 매치들 중에서 의미 있는 매치들 선별
meaningful = []
for m, n in bf_matches:
  if m.distance < 0.8*n.distance:
    meaningful.append(m)
print("{} 개의 의미 있는 매치 선별 완료!".format(len(meaningful)))output: 53 개의 의미 있는 매치 선별 완료!
추출한 matches를 그래프로 표시하기
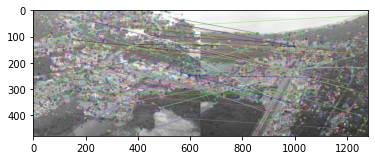
마지막으로 선별한 좋은 matches들을 시각화 해보는 단계이다. opencv에 있는 drawMatches method를 사용하며 유사한 descriptor를 갖는 keypoint들이 연결됨을 알 수 있다.
# 매치 그래프로 그리기
match_graph = cv2.drawMatches(gray1, kp1, gray2, kp2, meaningful, None)
plt.imshow(cv2.cvtColor(match_graph, cv2.COLOR_BGR2RGB))output:

